Comet/opik
Built by Metorial, the integration platform for agentic AI.
Monitor LLM performance
Automate evaluations
Integrate with CI/CD pipelines
Provide comprehensive tracing
Generate metrics for quality assurance
Server Summary
English | 简体中文 | 日本語 | 한국어
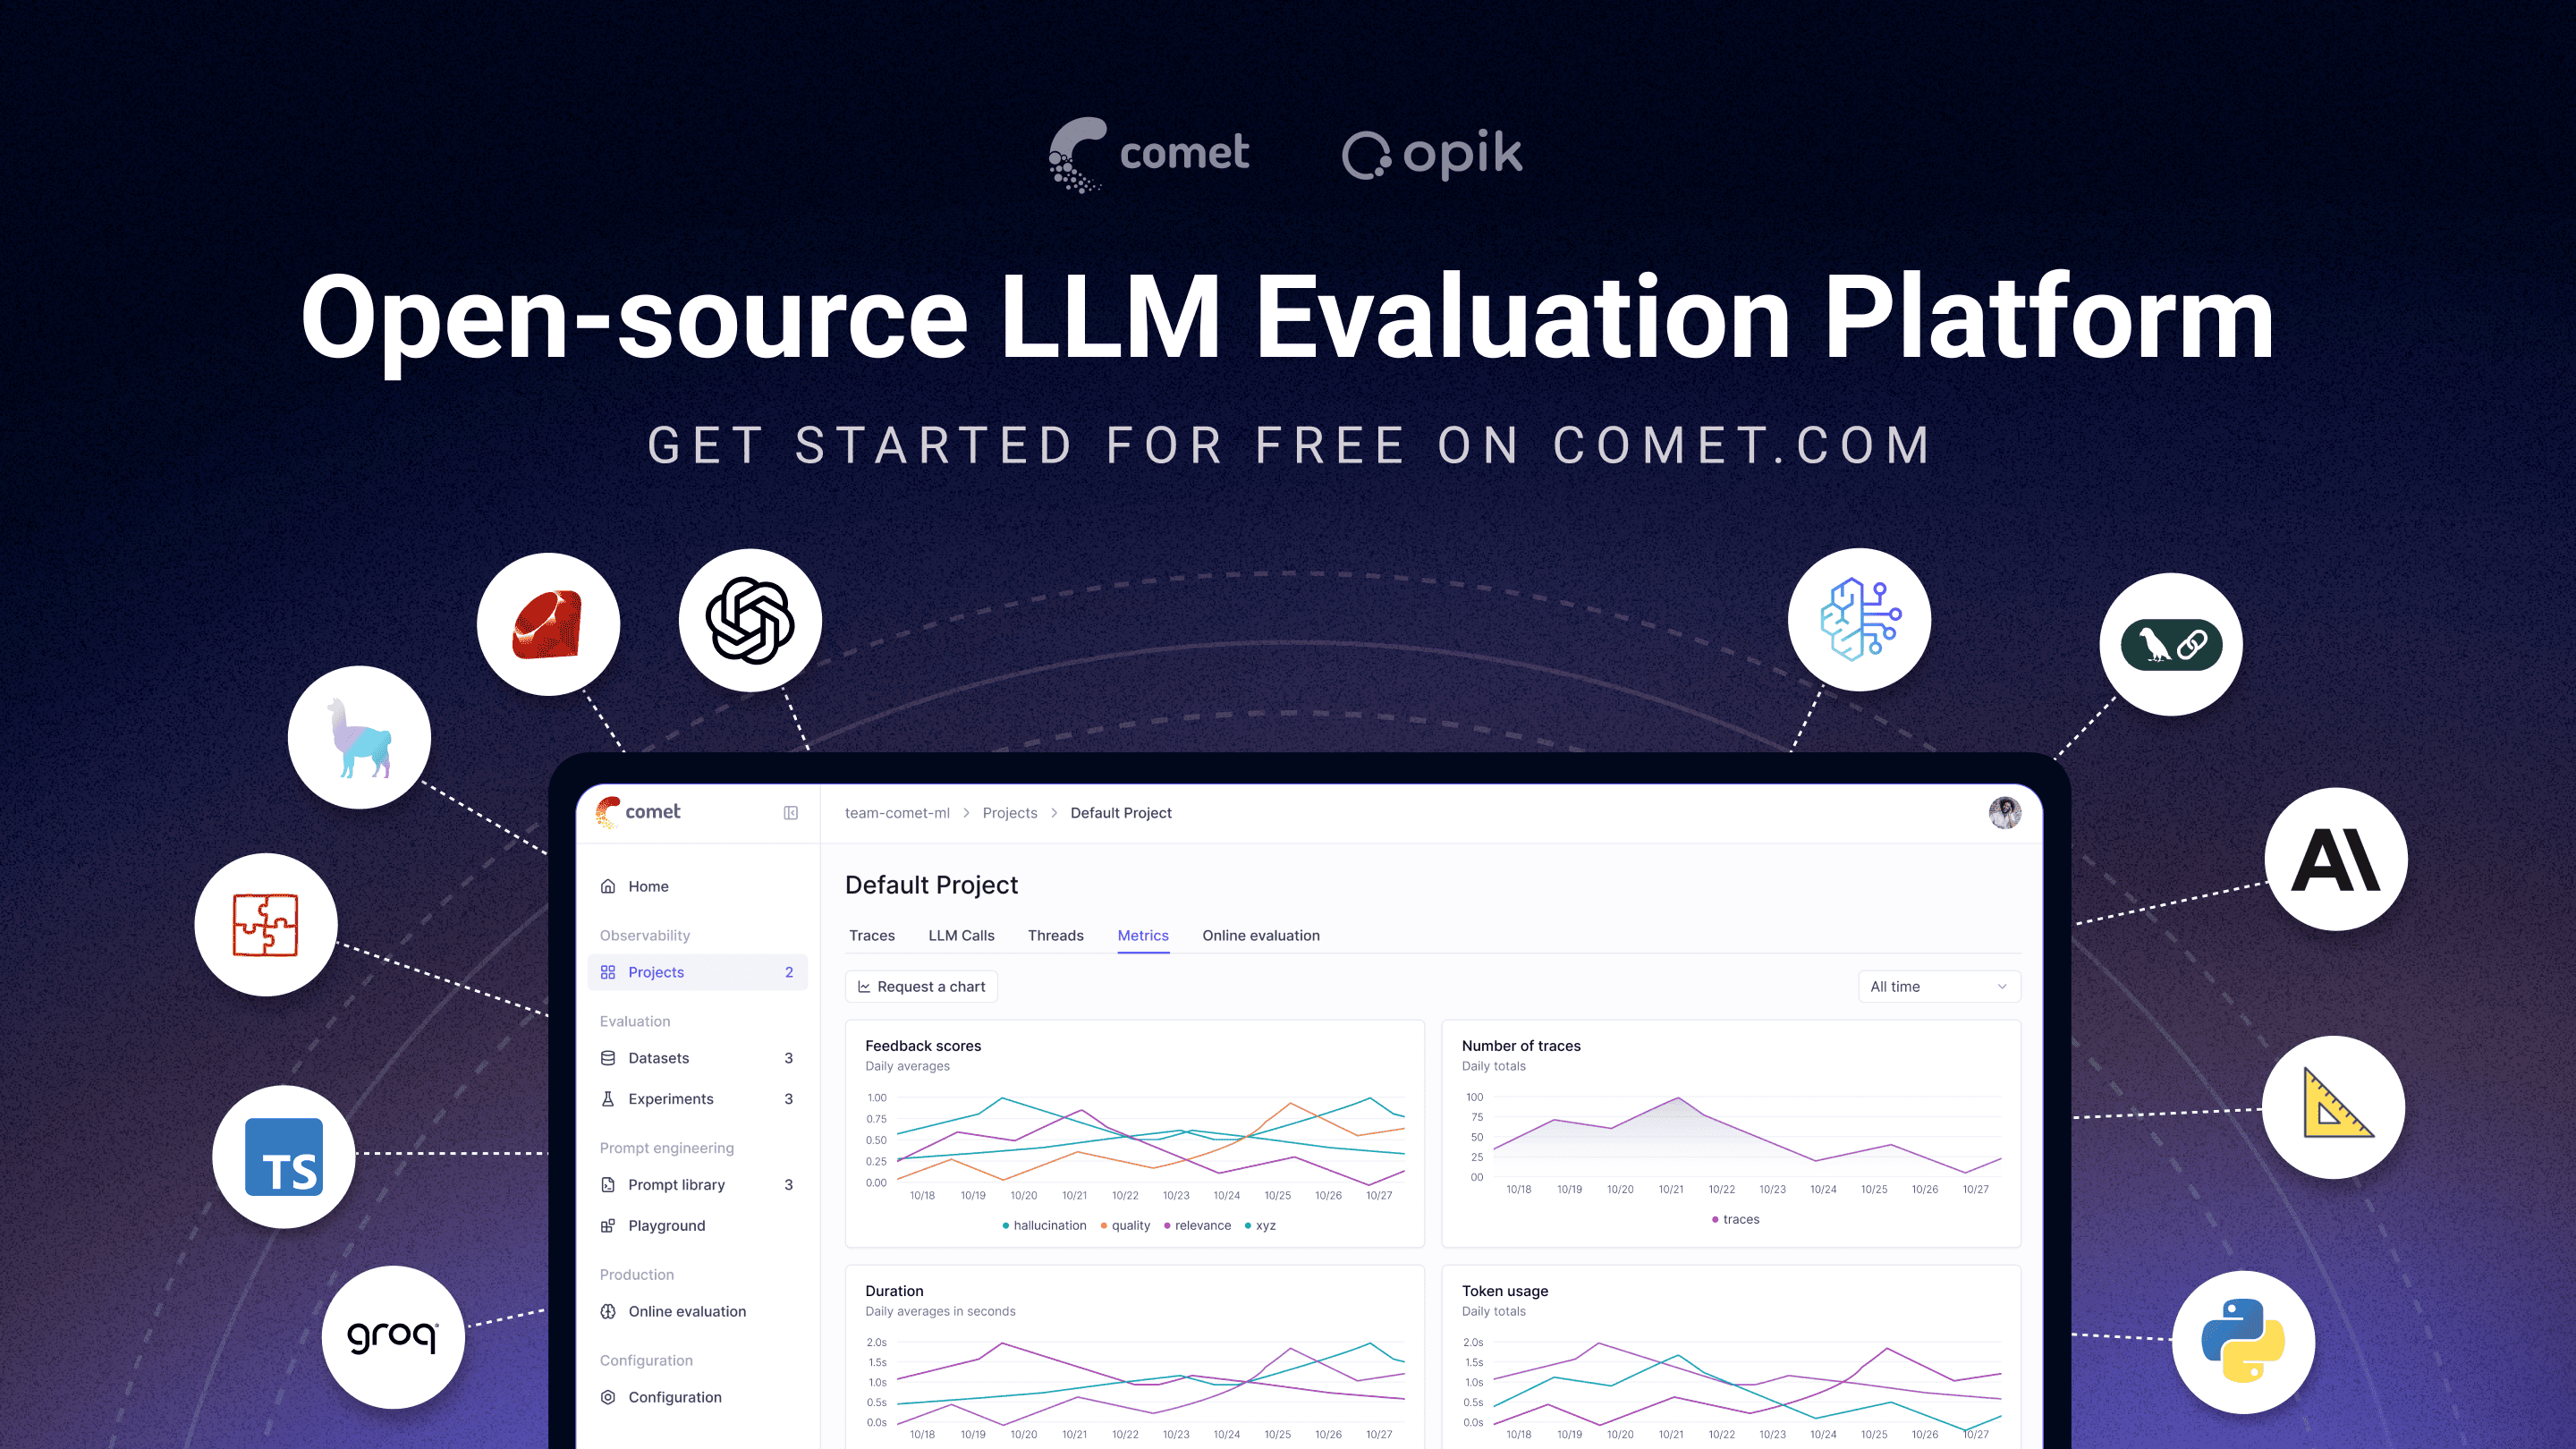
Opik
Open-source LLM evaluation platform
Opik helps you build, evaluate, and optimize LLM systems that run better, faster, and cheaper. From RAG chatbots to code assistants to complex agentic pipelines, Opik provides comprehensive tracing, evaluations, dashboards, and powerful features like Opik Agent Optimizer and Opik Guardrails to improve and secure your LLM powered applications in production.


![]()

Website •
Slack Community •
Twitter •
Changelog •
Documentation
🚀 What is Opik? • 🛠️ Opik Server Installation • 💻 Opik Client SDK • 📝 Logging Traces 🧑⚖️ LLM as a Judge • 🔍 Evaluating your Application • ⭐ Star Us • 🤝 Contributing
🚀 What is Opik?
Opik (built by Comet) is an open-source platform designed to streamline the entire lifecycle of LLM applications. It empowers developers to evaluate, test, monitor, and optimize their models and agentic systems. Key offerings include:
- Comprehensive Observability: Deep tracing of LLM calls, conversation logging, and agent activity.
- Advanced Evaluation: Robust prompt evaluation, LLM-as-a-judge, and experiment management.
- Production-Ready: Scalable monitoring dashboards and online evaluation rules for production.
- Opik Agent Optimizer: Dedicated SDK and set of optimizers to enhance prompts and agents.
- Opik Guardrails: Features to help you implement safe and responsible AI practices.
Key capabilities include:
-
Development & Tracing:
- Track all LLM calls and traces with detailed context during development and in production (Quickstart).
- Extensive 3rd-party integrations for easy observability: Seamlessly integrate with a growing list of frameworks, supporting many of the largest and most popular ones natively (including recent additions like Google ADK, Autogen, and Flowise AI). (Integrations)
- Annotate traces and spans with feedback scores via the Python SDK or the UI.
- Experiment with prompts and models in the Prompt Playground.
-
Evaluation & Testing:
- Automate your LLM application evaluation with Datasets and Experiments.
- Leverage powerful LLM-as-a-judge metrics for complex tasks like hallucination detection, moderation, and RAG assessment (Answer Relevance, Context Precision).
- Integrate evaluations into your CI/CD pipeline with our PyTest integration.
-
Production Monitoring & Optimization:
- Log high volumes of production traces: Opik is designed for scale (40M+ traces/day).
- Monitor feedback scores, trace counts, and token usage over time in the Opik Dashboard.
- Utilize Online Evaluation Rules with LLM-as-a-Judge metrics to identify production issues.
- Leverage Opik Agent Optimizer and Opik Guardrails to continuously improve and secure your LLM applications in production.
[!TIP] If you are looking for features that Opik doesn't have today, please raise a new Feature request 🚀
🛠️ Opik Server Installation
Get your Opik server running in minutes. Choose the option that best suits your needs:
Option 1: Comet.com Cloud (Easiest & Recommended)
Access Opik instantly without any setup. Ideal for quick starts and hassle-free maintenance.
👉 Create your free Comet account
Option 2: Self-Host Opik for Full Control
Deploy Opik in your own environment. Choose between Docker for local setups or Kubernetes for scalability.
Self-Hosting with Docker Compose (for Local Development & Testing)
This is the simplest way to get a local Opik instance running. Note the new ./opik.sh installation script:
On Linux or Mac Enviroment:
# Clone the Opik repository
git clone https://github.com/comet-ml/opik.git

# Navigate to the repository
cd opik

# Start the Opik platform
./opik.sh
On Windows Enviroment:
# Clone the Opik repository
git clone https://github.com/comet-ml/opik.git

# Navigate to the repository
cd opik

# Start the Opik platform
powershell -ExecutionPolicy ByPass -c ".\\opik.ps1"
Service Profiles for Development
The Opik installation scripts now support service profiles for different development scenarios:
# Start full Opik suite (default behavior)
./opik.sh

# Start only infrastructure services (databases, caches etc.)
./opik.sh --infra

# Start infrastructure + backend services
./opik.sh --backend

# Enable guardrails with any profile
./opik.sh --guardrails # Guardrails with full Opik suite
./opik.sh --backend --guardrails # Guardrails with infrastructure + backend
Use the --help or --info options to troubleshoot issues. Dockerfiles now ensure containers run as non-root users for enhanced security. Once all is up and running, you can now visit localhost:5173 on your browser! For detailed instructions, see the Local Deployment Guide.
Self-Hosting with Kubernetes & Helm (for Scalable Deployments)
For production or larger-scale self-hosted deployments, Opik can be installed on a Kubernetes cluster using our Helm chart. Click the badge for the full Kubernetes Installation Guide using Helm.
![]()
[!IMPORTANT] Version 1.7.0 Changes: Please check the changelog for important updates and breaking changes.
💻 Opik Client SDK
Opik provides a suite of client libraries and a REST API to interact with the Opik server. This includes SDKs for Python, TypeScript, and Ruby (via OpenTelemetry), allowing for seamless integration into your workflows. For detailed API and SDK references, see the Opik Client Reference Documentation.
Python SDK Quick Start
To get started with the Python SDK:
Install the package:
# install using pip
pip install opik

# or install with uv
uv pip install opik
Configure the python SDK by running the opik configure command, which will prompt you for your Opik server address (for self-hosted instances) or your API key and workspace (for Comet.com):
opik configure
[!TIP] You can also call
opik.configure(use_local=True)from your Python code to configure the SDK to run on a local self-hosted installation, or provide API key and workspace details directly for Comet.com. Refer to the Python SDK documentation for more configuration options.
You are now ready to start logging traces using the Python SDK.
📝 Logging Traces with Integrations
The easiest way to log traces is to use one of our direct integrations. Opik supports a wide array of frameworks, including recent additions like Google ADK, Autogen, AG2, and Flowise AI:
| Integration | Description | Documentation |
|---|---|---|
| ADK | Log traces for Google Agent Development Kit (ADK) | Documentation |
| AG2 | Log traces for AG2 LLM calls | Documentation |
| AIsuite | Log traces for aisuite LLM calls | Documentation |
| Agno | Log traces for Agno agent orchestration framework calls | Documentation |
| Anthropic | Log traces for Anthropic LLM calls | Documentation |
| Autogen | Log traces for Autogen agentic workflows | Documentation |
| Bedrock | Log traces for Amazon Bedrock LLM calls | Documentation |
| BeeAI | Log traces for BeeAI agent framework calls | Documentation |
| BytePlus | Log traces for BytePlus LLM calls | Documentation |
| Cloudflare Workers AI | Log traces for Cloudflare Workers AI calls | Documentation |
| Cohere | Log traces for Cohere LLM calls | Documentation |
| CrewAI | Log traces for CrewAI calls | Documentation |
| Cursor | Log traces for Cursor conversations | Documentation |
| DeepSeek | Log traces for DeepSeek LLM calls | Documentation |
| Dify | Log traces for Dify agent runs | Documentation |
| DSPY | Log traces for DSPy runs | Documentation |
| Fireworks AI | Log traces for Fireworks AI LLM calls | Documentation |
| Flowise AI | Log traces for Flowise AI visual LLM builder | Documentation |
| Gemini (Python) | Log traces for Google Gemini LLM calls | Documentation |
| Gemini (TypeScript) | Log traces for Google Gemini TypeScript SDK calls | Documentation |
| Groq | Log traces for Groq LLM calls | Documentation |
| Guardrails | Log traces for Guardrails AI validations | Documentation |
| Haystack | Log traces for Haystack calls | Documentation |
| Instructor | Log traces for LLM calls made with Instructor | Documentation |
| LangChain (Python) | Log traces for LangChain LLM calls | Documentation |
| LangChain (JS/TS) | Log traces for LangChain JavaScript/TypeScript calls | Documentation |
| LangGraph | Log traces for LangGraph executions | Documentation |
| LiteLLM | Log traces for LiteLLM model calls | Documentation |
| LiveKit Agents | Log traces for LiveKit Agents AI agent framework calls | Documentation |
| LlamaIndex | Log traces for LlamaIndex LLM calls | Documentation |
| Mastra | Log traces for Mastra AI workflow framework calls | Documentation |
| Microsoft Agent Framework (Python) | Log traces for Microsoft Agent Framework calls | Documentation |
| Microsoft Agent Framework (.NET) | Log traces for Microsoft Agent Framework .NET calls | Documentation |
| Mistral AI | Log traces for Mistral AI LLM calls | Documentation |
| Novita AI | Log traces for Novita AI LLM calls | Documentation |
| Ollama | Log traces for Ollama LLM calls | Documentation |
| OpenAI (Python) | Log traces for OpenAI LLM calls | Documentation |
| OpenAI (JS/TS) | Log traces for OpenAI JavaScript/TypeScript calls | Documentation |
| OpenAI Agents | Log traces for OpenAI Agents SDK calls | Documentation |
| OpenRouter | Log traces for OpenRouter LLM calls | Documentation |
| OpenTelemetry | Log traces for OpenTelemetry supported calls | Documentation |
| Pipecat | Log traces for Pipecat real-time voice agent calls | Documentation |
| Predibase | Log traces for Predibase LLM calls | Documentation |
| Pydantic AI | Log traces for PydanticAI agent calls | Documentation |
| Ragas | Log traces for Ragas evaluations | Documentation |
| Semantic Kernel | Log traces for Microsoft Semantic Kernel calls | Documentation |
| Smolagents | Log traces for Smolagents agents | Documentation |
| Spring AI | Log traces for Spring AI framework calls | Documentation |
| Strands Agents | Log traces for Strands agents calls | Documentation |
| Together AI | Log traces for Together AI LLM calls | Documentation |
| Vercel AI SDK | Log traces for Vercel AI SDK calls | Documentation |
| VoltAgent | Log traces for VoltAgent agent framework calls | Documentation |
| WatsonX | Log traces for IBM watsonx LLM calls | Documentation |
| xAI Grok | Log traces for xAI Grok LLM calls | Documentation |
[!TIP] If the framework you are using is not listed above, feel free to open an issue or submit a PR with the integration.
If you are not using any of the frameworks above, you can also use the track function decorator to log traces:
import opik

opik.configure(use_local=True) # Run locally

@opik.track
def my_llm_function(user_question: str) -> str:
    # Your LLM code here

    return "Hello"
[!TIP] The track decorator can be used in conjunction with any of our integrations and can also be used to track nested function calls.
🧑⚖️ LLM as a Judge metrics
The Python Opik SDK includes a number of LLM as a judge metrics to help you evaluate your LLM application. Learn more about it in the metrics documentation.
To use them, simply import the relevant metric and use the score function:
from opik.evaluation.metrics import Hallucination

metric = Hallucination()
score = metric.score(
    input="What is the capital of France?",
    output="Paris",
    context=["France is a country in Europe."]
)
print(score)
Opik also includes a number of pre-built heuristic metrics as well as the ability to create your own. Learn more about it in the metrics documentation.
🔍 Evaluating your LLM Application
Opik allows you to evaluate your LLM application during development through Datasets and Experiments. The Opik Dashboard offers enhanced charts for experiments and better handling of large traces. You can also run evaluations as part of your CI/CD pipeline using our PyTest integration.
⭐ Star Us on GitHub
If you find Opik useful, please consider giving us a star! Your support helps us grow our community and continue improving the product.
🤝 Contributing
There are many ways to contribute to Opik:
- Submit bug reports and feature requests
- Review the documentation and submit Pull Requests to improve it
- Speaking or writing about Opik and letting us know
- Upvoting popular feature requests to show your support
To learn more about how to contribute to Opik, please see our contributing guidelines.